MAXI Custom Plot Classes (gdt.missions.maxi.plot)
There are a few MAXI-specific plot classes that extend the functionality of
those provided in The Plot Package. These classes
primarily augment the plotting of the MAXI/GSC fields-of-view (FOVs) on the sky,
with a plot class that draws a GSC FOV on a sky plot (MaxiDetectorFov) and
a base class sky plot, MaxiSkyPlot, that enables the plotting of the FOV
object.
We can initialize the MaxiSkyPlot by calling it in the same way that we
create a SkyPlot object. SkyPlot, itself, is a base class for plotting in
equatorial, Galactic, and spacecraft coordinates, and there are sub-classed
MAXI plot classes that we can use. For example, if we want to plot in the ICRS
frame, we use MaxiEquatorialPlot:
>>> import matplotlib.pyplot as plt
>>> from gdt.missions.maxi.plot import MaxiEquatorialPlot
>>> eqplot = MaxiEquatorialPlot(interactive=True)
>>> plt.show()
Then, we can plot one of the GSC FOVs using the MaxiDetectorFov, which is
a special type of SkyPolygon. The polygon is defined by GscFov (see
MAXI/GSC Detector Definitions for details), which requires
a MaxiFrame that defines how the FOV is rotated from the MAXI reference frame
into the celestial frame. We will use the example frame used
here and make one small change to add the GSC FOV definitions
to the frame so that the plotter knows how to rotate and plot the FOVs:
>>> from gdt.core.coords import Quaternion
>>> from gdt.missions.maxi.frame import MaxiFrame
>>> from gdt.missions.maxi.gsc.detectors import GscFov
>>> quat = Quaternion([-0.218,  0.009,  0.652, -0.726])
>>> maxi_frame = MaxiFrame(quaternion=quat, detectors=GscFov)
Finally, we add the frame we created to our plot:
>>> eqplot.add_frame(maxi_frame, earth=False, sun=False)
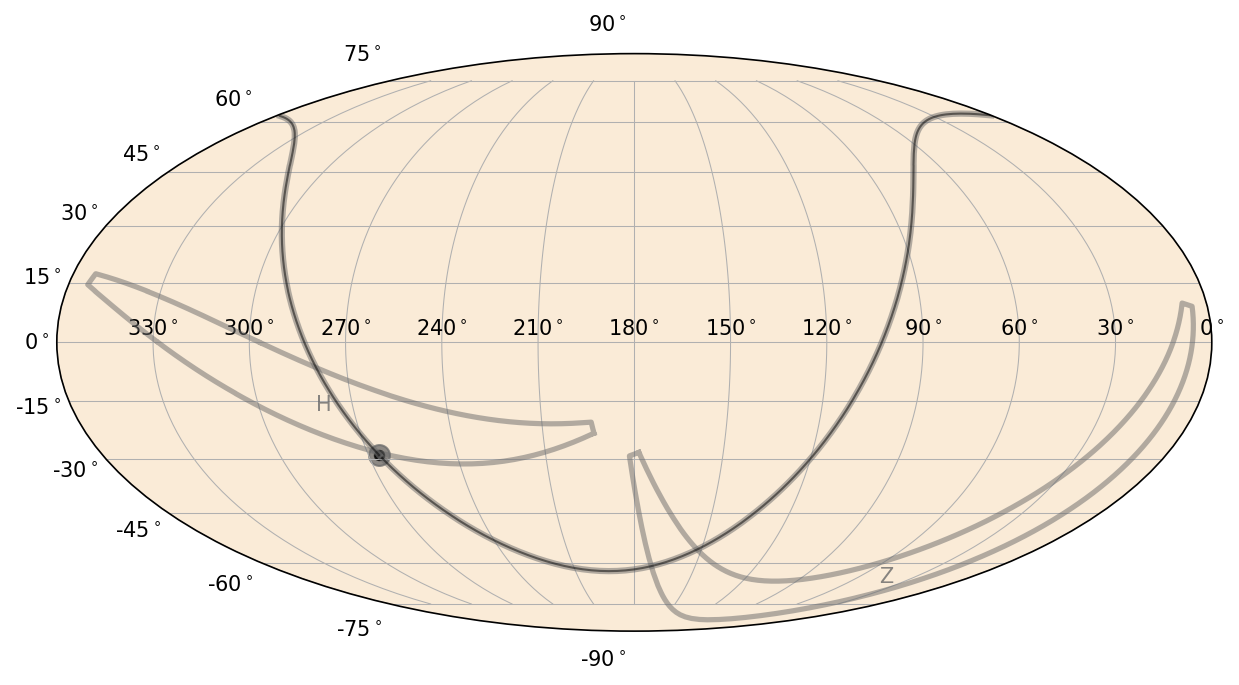
This plots the GSC-H and GSC-Z FOVs on the sky in RA/Dec. You will also notice the curve and point denoting the Galactic Plane and Center. We set keywords to not plot the sun or location of the Earth from the MAXI point-of-view; to plot those, we would need to set the obstime and obsgeoloc properties of the frame (see Maxi Orbit Files and Maxi Attitude Files for more information).
The plot objects for the field of view can be accessed in the following way:
>>> eqplot.detectors
<PlotElementCollection: 2 MaxiDetectorFov objects>
>>> eqplot.detectors.H
<MaxiDetectorFov: 'H';
                  face_color=dimgray;
                  face_alpha=0.0;
                  edge_color=dimgray;
                  edge_alpha=0.5;
                  linestyle='-';
                  linewidth=2.5;
                  fontsize=10;
                  font_color=dimgray;
                  font_alpha=0.8>
>>> eqplot.detectors.Z
<MaxiDetectorFov: 'Z';
                  face_color=dimgray;
                  face_alpha=0.0;
                  edge_color=dimgray;
                  edge_alpha=0.5;
                  linestyle='-';
                  linewidth=2.5;
                  fontsize=10;
                  font_color=dimgray;
                  font_alpha=0.8>
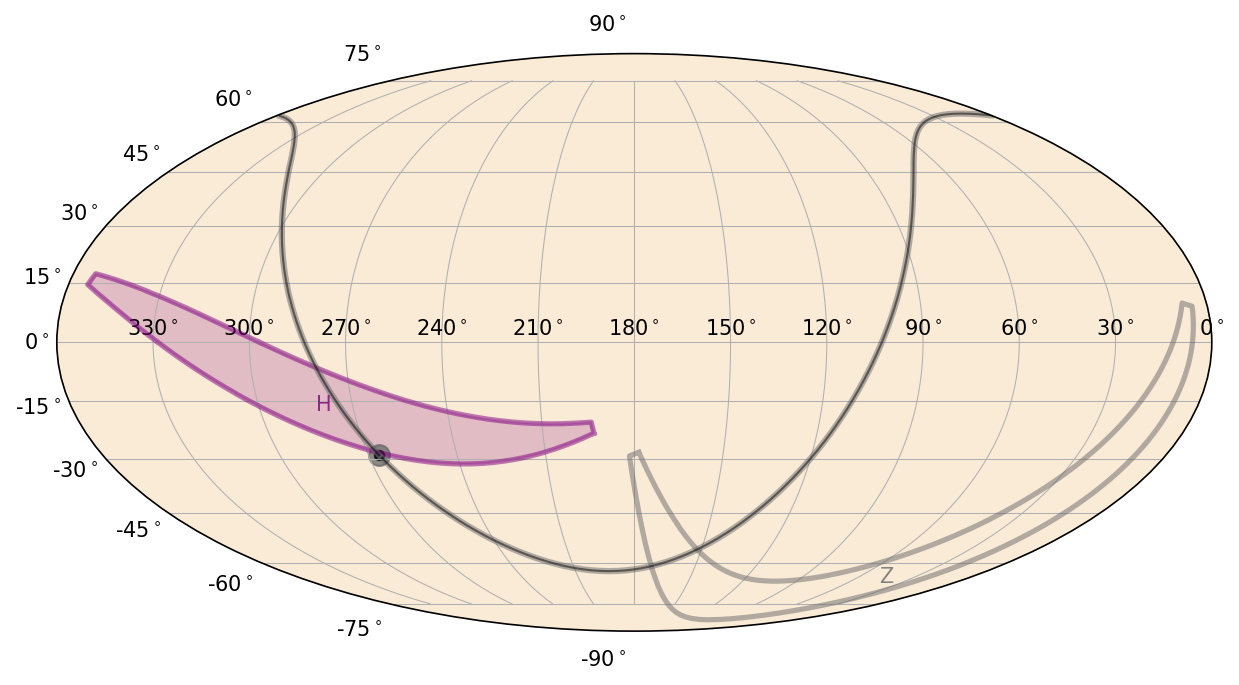
There are a number of properties we can change. For example, we can change the GSC-H FOV into a filled polygon with a purple color:
>>> eqplot.detectors.H.face_alpha = 0.2
>>> eqplot.detectors.H.face_color = 'purple'
>>> eqplot.detectors.H.edge_color = 'purple'
>>> eqplot.detectors.H.font_color = 'purple'
For more information on plotting objects on the sky, see Plotting Sky Maps, Localizations, and Wide-field Effective Areas.
Reference/API
gdt.missions.maxi.plot Module
Classes
|
Plot a MAXI FOV on the sky in equatorial, galactic, or spacecraft coordinates. |
|
Custom class for plotting in equatorial coordinates with the MAXI FOVs. |
|
Custom class for plotting in galactic coordinates with the MAXI FOVs. |
|
Custom class for plotting in MAXI coordinates with the MAXI FOVs. |
|
Custom base class for plotting the MAXI pointings on the sky. |
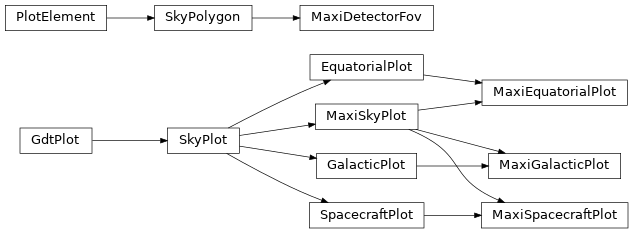
Class Inheritance Diagram